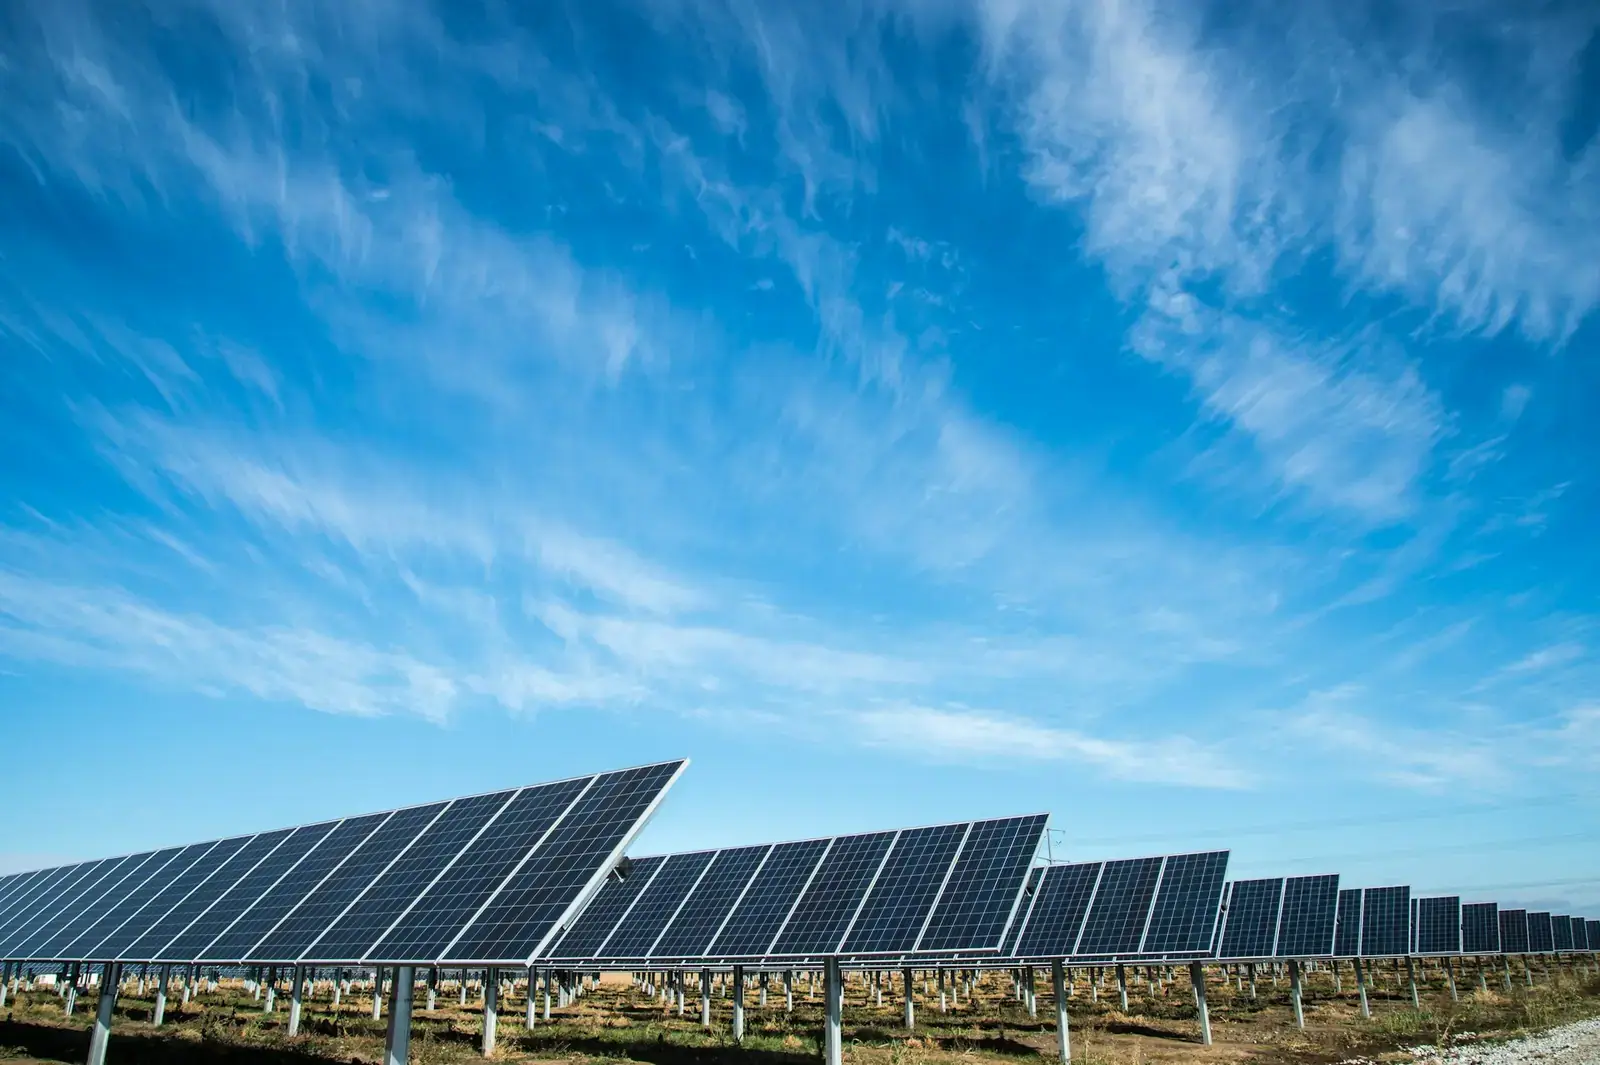
In most of Gujarat, a well-placed rooftop solar system makes roughly 4 to 4.5 units (kWh) per kW per day averaged over the year. Output is highest from February to May, at around 5 units per kW per day. It drops to about 2.5 to 3 in July and August, then climbs back to around 4.5 from October to January. The monsoon dip is real, but it is short, and the rest of the year makes up for it.
Where these numbers come from
The figures in this post are estimates from PVGIS, the free solar calculator run by the European Commission's Joint Research Centre. It uses satellite-based weather data for 2005 to 2023. We ran it for a 1 kW system facing south at a 20 degree tilt, with 14% system losses. That is a fairly standard rooftop setup.
Treat these as a guide, not a promise. Your real output depends on shade, dust, which way your roof faces, the tilt, and the quality of the panels and inverter. Some days will be better than average, some worse. For a reality check, PIB's official explainer on PM Surya Ghar says a 3 kW system can generate over 300 units a month on average, which sits comfortably inside these estimates.
Month by month across Gujarat
Estimated daily output per 1 kW of panels (units per day):
| Month | Ahmedabad | Rajkot | Surat | Bhuj (Kutch) |
|---|---|---|---|---|
| January | 4.9 | 5.0 | 4.9 | 5.1 |
| February | 5.2 | 5.2 | 5.2 | 5.3 |
| March | 5.2 | 5.2 | 5.2 | 5.3 |
| April | 5.2 | 5.2 | 5.1 | 5.3 |
| May | 4.9 | 4.9 | 4.8 | 5.1 |
| June | 3.9 | 3.8 | 3.7 | 4.3 |
| July | 2.6 | 2.6 | 2.6 | 3.2 |
| August | 2.6 | 2.7 | 2.9 | 3.2 |
| September | 3.5 | 3.5 | 3.5 | 4.0 |
| October | 4.7 | 4.6 | 4.5 | 4.8 |
| November | 4.6 | 4.6 | 4.5 | 4.7 |
| December | 4.6 | 4.7 | 4.6 | 4.8 |
| Yearly average | 4.3 | 4.3 | 4.3 | 4.6 |
Our district pages use a simpler rule of thumb, so their figures can differ from these by 0.1 to 0.2 units. Treat both as approximate.
The pattern is the same across the state. Kutch does a little better all year, and noticeably better in the monsoon. South Gujarat (Surat, Valsad) has the cloudiest monsoon months. Vadodara and Valsad came out at about 4.2 units per kW per day for the year, and Palanpur in north Gujarat at about 4.3.
Summer (March to May): the best stretch
Clear skies and long days make February to April the strongest months, at around 5.2 units per kW per day. A 3 kW system would make roughly 15 to 16 units on a typical day.
You might expect May, the hottest month, to be the best. It is actually slightly lower. Solar panels make less power per unit of sunlight when they get very hot, and late summer also brings more haze and dust in the air. PVGIS includes the effect of panel temperature in its estimates. Dust on the panels themselves is a separate loss, and it adds up quickly in a dry Gujarat summer. Regular cleaning matters most in these months; our post on solar panel cleaning and maintenance covers how often and how.
Summer is also when your AC and coolers run the most. So the months with the highest generation line up nicely with the months with the highest use.
Monsoon (June to September): the dip
The monsoon is when output falls the most. In July and August most of Gujarat drops to around 2.5 to 3 units per kW per day, roughly half of what you get in March. June and September sit in between, because the rains arrive and leave gradually.
Two things are worth knowing:
- Panels still work on cloudy days. They run on daylight, not just direct sun, so even an overcast day produces something. A heavy, dark day of rain produces very little; a broken-cloud day can be close to normal.
- The rain cleans the panels. After the dusty summer, the first few good showers wash the panels for free. You can usually relax the cleaning schedule in these months.
The monsoon dip is one reason installers size systems on yearly averages rather than on the best month. If you size for July, you will have far more than you need for the other eight or nine months.
Winter (October to February): steady and strong
Once the monsoon withdraws, output recovers quickly. October to January runs at about 4.5 to 4.9 units per kW per day, and February is back at peak levels. Days are shorter, but the skies over Gujarat are usually clear and dry, and cooler panels work more efficiently.
Your electricity use is often lowest in winter, especially if you have no AC running. That means winter is when you are most likely to send extra power to the grid.
What this means for your bill
With net metering, the seasons balance out. In winter and spring you will often export more than you use during the day. In the monsoon you will draw more from the grid. The net meter records both directions, and your bill reflects the difference. Our post on net metering in Gujarat explains how this works.
A simple way to estimate your own yearly generation:
- Take the yearly average for your area, about 4.2 to 4.6 units per kW per day.
- Multiply by your system size in kW.
- Multiply by 365.
For example, a 3 kW system in Ahmedabad at about 4.3 units per kW per day works out to roughly 4,700 units a year, or close to 390 units a month on average. Compare that with the units (not the rupees) on your last 12 electricity bills. Our guide on what size solar system you need walks through this in more detail.
Things that matter more than the season
The season is out of your control, but these are not:
- Shade. Even a small shadow from a water tank, parapet or neighbour's building can cut output noticeably. A shade-free spot matters more than anything in the table above.
- Direction and tilt. South-facing panels at a moderate tilt do best in Gujarat. East or west facing still works, with some loss.
- Clean panels. Dust is the biggest controllable loss in Gujarat's dry months.
- A checked installer. Good wiring, a correctly sized inverter and proper mounting all show up in the units you get.
Next step
Pull out your last 12 electricity bills and note the units used each month. Put them next to the monthly table above for your area, and you will see quickly how solar would match your use through the year. If you want, we can connect you with one checked installer near you who can check your roof for shade and give you a site-specific estimate. You can also see which districts are covered on our Gujarat installation page.
This guide is general information, not advice. Scheme rules and amounts change, so check the official portal or your DISCOM before you decide.